Prior Auth Turnaround Time Benchmarks for Medical Practices
Practices spend 13 hours weekly on prior auth—benchmarking turnaround times cuts real costs.

Prior authorization is a routine part of running a medical practice, eating a fixed and predictable share of physician and staff time every single week — far more than an occasional paperwork detour. The American Medical Association's 2025 survey found that the average practice handles roughly 40 prior authorization requests per physician per week, and spends close to 13 hours on the process. Multiply that across a full staff and a full year, and prior auth starts to look less like a rare interruption and more like a second job, layered on top of clinical care.
The cost math backs this up, too. CAQH's 2024 Index put the cost of a manually processed prior auth transaction at nearly $11, with fully electronic processing cutting that figure roughly in half. Run either number against 40 requests a week per physician, and benchmarking turnaround time starts to look less like an efficiency nicety and more like a budget line, the same as payroll or supply costs.
What "turnaround time" actually measures, and where practices get it wrong
Ask five practices what "turnaround time" means and you'll get three different answers, each measured from a different starting point. Some clocks start the moment a service gets ordered. Others start when the request lands with the payer. A smaller group waits until the payer confirms all required documentation is in hand before starting the clock at all. None of these are wrong on their own terms, but they aren't measuring the same thing, and treating them as interchangeable is how a practice ends up with a benchmark that describes nothing real.
Measuring only from submission is the most common mistake, and it's the one that hides the real problem. The gap between when a service is ordered and when the request actually goes out the door is often the biggest delay in the whole cycle, and it never shows up if the clock doesn't start until the paperwork lands at the payer. The payer's decision clock is just one link in a longer chain that includes intake, gathering documentation, prepping the submission, and chasing it down when nothing happens.
There's a distinction that gets flattened constantly: standard requests and expedited requests run on entirely different clocks, and averaging them together produces a number that describes neither. Pharmacy PA and medical or surgical PA suffer the same fate. Different workflows, different documentation, different payer systems, all folded into one turnaround figure that hides exactly where the time went. And "decision" itself needs a firm definition, because approval, denial, and a request for more information carry three different downstream time costs. Lumping them into one bucket labeled "responded" just buries the number you actually need.
Regulatory turnaround time standards that now function as the industry baseline
CMS-0057-F, finalized in January 2024, gives the industry its first real floor. The rule sets mandatory decision timelines for Medicare Advantage, Medicaid managed care, CHIP, and ACA marketplace plans. For 2025, standard requests must get a decision within 14 calendar days for MA and Medicaid managed care, and 15 days for ACA marketplace plans. Starting January 1, 2026, those windows tighten hard: 7 calendar days for standard requests, 72 hours for expedited ones.
These are payer-side clocks, and that matters more than it sounds. The clock starts once the payer receives a complete request, so a practice that submits incomplete documentation gets no benefit from the deadline; the payer can reasonably restart the clock once the gaps are filled. Which means the regulatory floor only protects the practices that hold up their end first.
CMS is also requiring payers to publicly post prior auth metrics annually, starting with 2025 data due March 31, 2026: approval rates, denial rates, average turnaround, appeals outcomes. That will be the first real apples-to-apples comparison across payers practices have ever had, and it's worth treating as a planning input the day it lands. Layer on top of that the FHIR API mandate, requiring payers to have Prior Authorization FHIR APIs live by January 1, 2027, and submission timing and status tracking are both about to change at a technical level.
Once 2026 hits, a request sitting unanswered past 7 days means one of two things: a compliance violation on the payer's side, or an incomplete submission on the practice's side. Both are fixable, but they call for different fixes.
Where delays actually cluster: payer, specialty, and request type as the key variables
Payer type drives more variance in turnaround time than almost anything else a practice controls. Medicare Advantage plans sit under CMS oversight, yet denial rates still swing widely from plan to plan; in 2024, MA insurers fully or partially denied 4.1 million prior auth requests, about 7.7% of the total, per KFF data. Commercial payers have no uniform federal deadline until the 2026 rule kicks in fully, and state-mandated timeframes create a patchwork that any multi-state practice has to track payer by payer. Medicaid managed care timelines ride on whatever contract terms each state negotiated, so a benchmark that works in one state can be meaningless in the next.
Specialty matters just as much. High-volume specialties, oncology, radiology, orthopedics, behavioral health, tend to run longer average review times, because their requests get matched against more complex clinical evidence standards. Request type adds another layer: new requests versus continuations, urgent versus standard, first submissions versus resubmissions, each with its own expected timeline. Average across all of them and you're really averaging several different processes while pretending it's one.
Submission channel deserves more attention than it usually gets. Phone-based submissions are still common for a real share of transactions, and phone queues add hold time that portal and electronic submissions simply don't carry. Denial trends make this worse: per the AMA's 2025 survey, three in four physicians say denials have increased over the past five years. Every denial kicks off an appeal cycle, and that cycle deserves its own benchmark. More than eight in ten appealed denials in Medicare Advantage get overturned, according to KFF. Sit with that number for a second: most of the extended turnaround in that segment reflects avoidable delay rather than careful clinical review running long.
Internal process steps that add delay before a request ever reaches a payer
Call it internal lag: the stretch between when a service is ordered and when the request reaches the payer. It's often just as long as the payer's own decision window, and most practices never track it as its own number. That's a real blind spot. It means roughly half the total cycle is invisible to the people trying to manage it.
Several steps inside that lag eat time, one after another. First, eligibility and auth-requirement verification: does this service even need PA, and is the patient's coverage active, before anyone starts building the request. Then clinical documentation gathering, usually the most time-intensive step, where staff pull notes, imaging, labs, and specialist letters out of the EHR and reshape them into whatever format a given payer wants. Then criteria matching: holding the documentation against the payer's clinical criteria, often sitting in a completely separate portal, which means staff juggling two systems in their head at once. Then submission routing, hunting down the right portal, phone line, or fax for that specific payer-service pairing. And finally status follow-up: checking for a response, answering requests for more information, escalating anything gone quiet.
Documentation completeness at submission is the single highest-leverage thing a practice actually controls. An incomplete submission resets the decision clock and drives a large share of denials outright. The AMA's 2025 denial analysis found that most PA denials trace back to incomplete documentation, wrong coding, or missed payer-specific criteria, all of it happening inside the practice, before the payer ever weighs in. Staff bouncing between the EHR, payer portals, and phone queues is where manual time piles up fastest, and it's also the part most within reach to fix.
What a realistic turnaround time benchmark looks like across the full request cycle
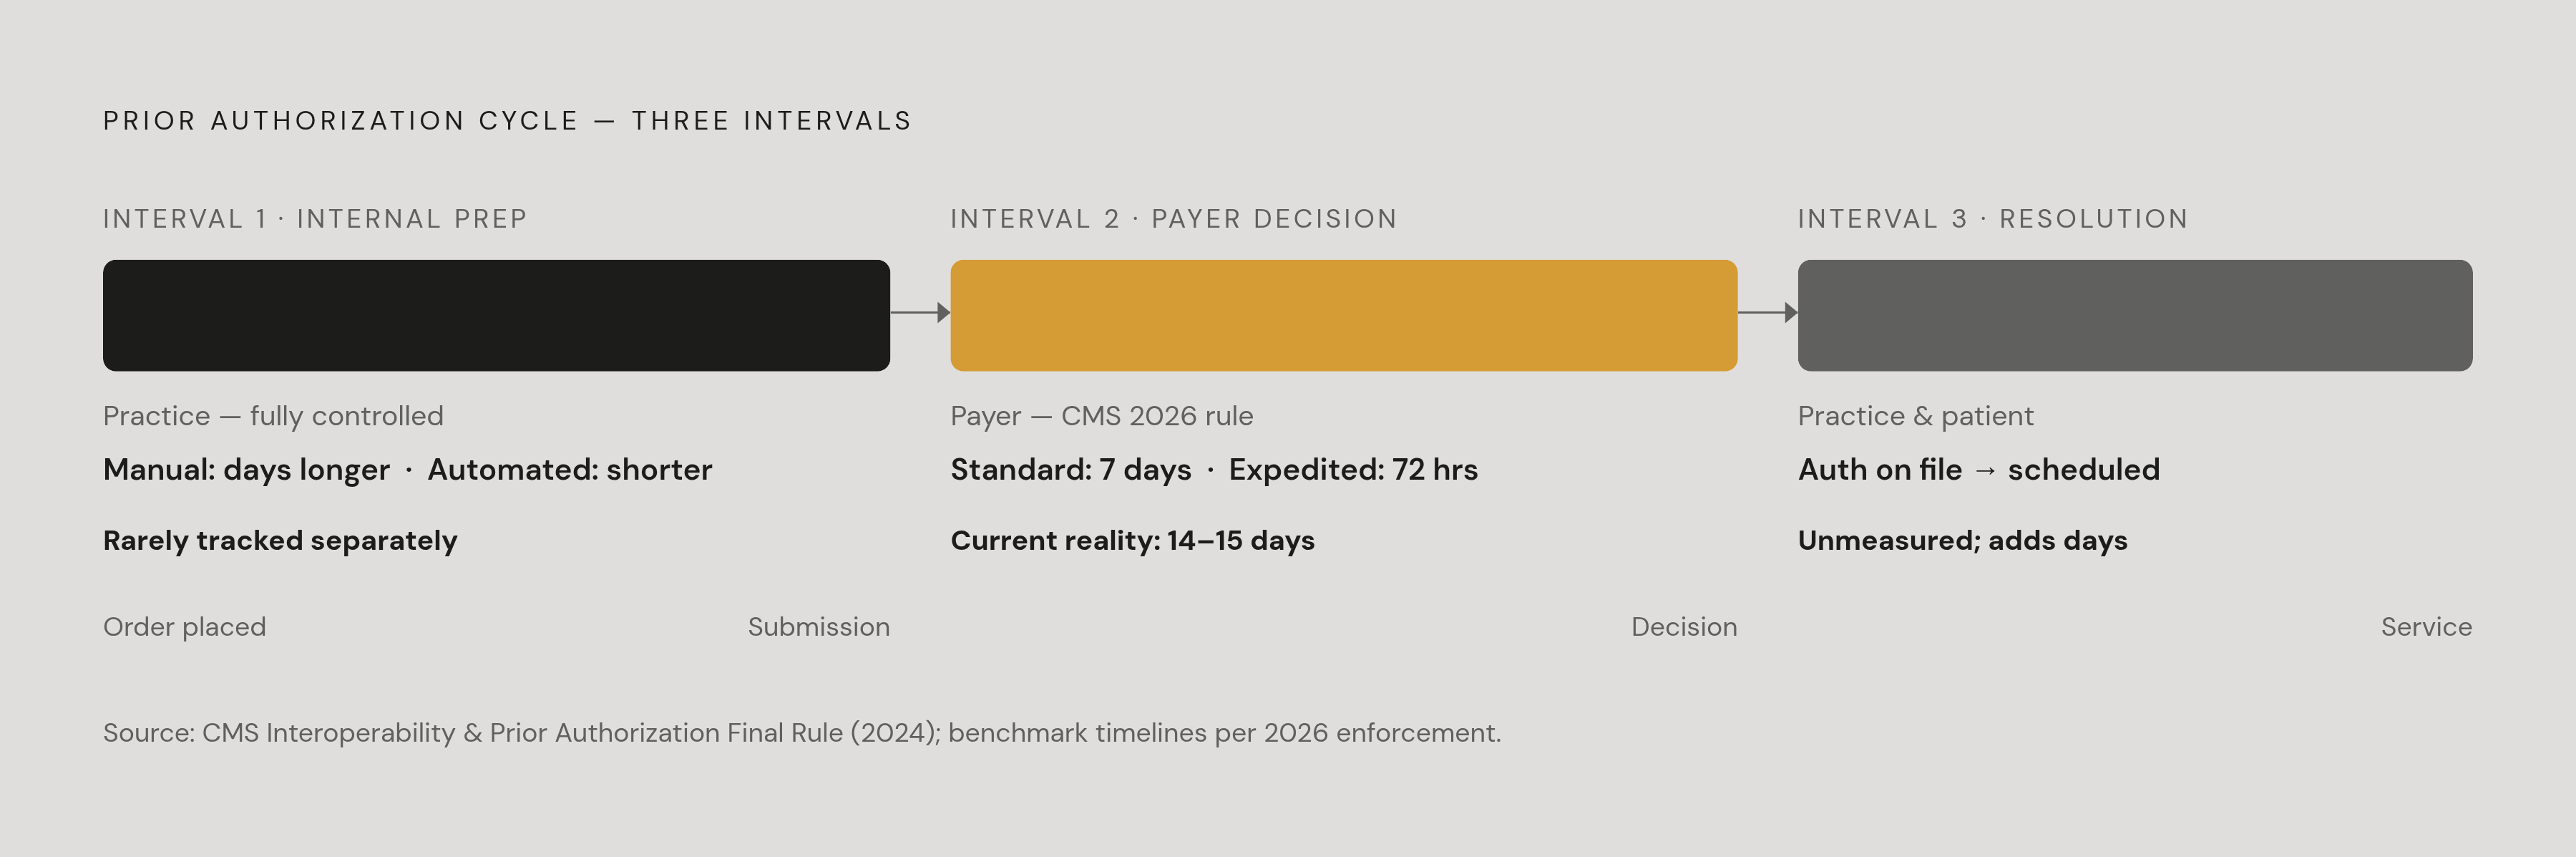
A full PA cycle breaks into three intervals. Track each on its own; don't collapse the whole thing into a single end-to-end number. Internal prep time runs from order to submission, the window a practice fully controls; manual workflows run considerably longer here than automated ones, and MGMA's 2025 Revenue Cycle Benchmark Report found automation cuts this timeline sharply. Payer decision time runs from submission to decision, and should get measured against the regulatory floor, 7 days standard and 72 hours expedited once 2026 arrives, and increasingly against the public payer data CMS starts requiring soon. Resolution time covers decision to authorization on file, then to a scheduled service; it's the handoff nobody measures, and it can quietly tack on days of its own.
Rough ranges follow. A straightforward medical or surgical PA, complete documentation, submitted electronically through a portal, should see a payer decision inside 3 to 7 days. That's an achievable baseline, not a stretch goal. A complex specialty request, or any request that goes out incomplete the first time, commonly runs 2 to 4 weeks end to end; anything past that points to a broken process, not bad luck. Expedited requests now carry a 72-hour regulatory floor, not a best-case guess. And the denial-appeal cycle deserves its own line: more than eight in ten MA appeals get overturned, per KFF, but the appeal itself adds weeks to resolution time. Appeal frequency is really a benchmark for submission quality, not just a downstream annoyance.
Gold carding gives practices a concrete finish line. Texas, Louisiana, Michigan, Vermont, and West Virginia have all enacted programs that exempt providers with consistently high approval rates from PA requirements entirely. That's where sustained turnaround improvement actually leads, a measurable business outcome instead of a spreadsheet exercise. Practices are better off building a payer-specific turnaround log than leaning on one global average; the spread across payers within the same specialty can be wide enough to shape staffing and scheduling on its own.
How automation changes which part of the cycle improves first
Automation's first and biggest effect lands on internal prep time, not payer decision time. Easy to get that backward. Practices expect automation to make the payer move faster; in practice, it tends to make the practice move faster instead, since the internal lag, fully within the practice's own control, is what shrinks first.
Concretely: automation runs eligibility and auth-requirement checks at the moment of order entry, not after a visit is already on the schedule. It pulls documentation straight from the EHR and maps it against payer-specific criteria without a staff member paging through a chart by hand. It routes submissions using logic that already knows which portal a given payer-service pairing needs. And it watches status continuously, instead of waiting for a staff member's next check-in.
The bigger payoff is denial prevention. Submit complete, criteria-matched documentation the first time, and the resubmission-and-appeals cycle that eats the most total time never starts. A 2025 JAMA study found that PA software giving practices real-time visibility into payer criteria cut denial rates substantially, and the mechanism was earlier visibility, not simply faster submission. Voice AI still matters here too, since it covers the phone-based PA workflows that portal and FHIR automation can't touch yet, and phone still accounts for a real share of total volume.
EHR-embedded workflows, where staff review and approve requests without switching applications, show better adoption and cleaner submissions than standalone PA tools, largely because clinical context stays visible right at the point of decision. Computer-using agents, tools that operate EHR screens and payer portals the way a staff member would by hand, can run these same steps across any system combination without needing a native API integration. That matters for practices whose EHR has no built-in PA module, or whose payers haven't gone live on FHIR yet. One case, reported by HealthTech Magazine in 2026, describes a health system that cut its claims appeals cycle from roughly two weeks of manual nurse review down to one or two days, using an AI agent that reads denial letters, assembles corrected documentation, and routes the result to a nurse for approval.
Building a measurement practice that turns benchmarks into operational targets
Turnaround time needs tracking at three levels: by payer, by service line or CPT code, and by submission channel. One global average hides the exact variance that should be driving staffing and scheduling decisions in the first place.
Each of the three intervals, internal prep, payer decision, resolution, needs its own target rather than one blended number. Whichever interval misses its target first is the one to fix first; there's no point tuning a payer relationship if the real problem is sitting upstream in documentation gathering. Denial rate works well as a leading indicator here. A rising denial rate in a specific service line almost always points to a documentation or criteria-matching problem inside the practice, not a shift in payer behavior, and it's cheaper to fix than to appeal around.
Payer public reporting, required annually under CMS-0057-F starting with 2025 data, will give practices their first consistent external comparison the day it publishes. Start tracking payer-level numbers now, well ahead of that, so there's something to measure against once the data lands. Gold card eligibility thresholds, typically a sustained high approval rate over a defined period under state law, give practices a target that pays off directly: fewer PA requirements for qualifying providers and services. Staff time saved per request is worth tracking too, as a secondary number that proves the operational changes are working and justifies whatever got spent on them.
Benchmarks aren't static, and treating them as fixed after year one is a mistake. Revisit them when payer contracts renew, when CMS deadlines hit (January 2026 for decision windows, January 2027 for FHIR APIs), and whenever a new service line gets added. Those are exactly the moments the baseline shifts underneath you, and a benchmark measured against last year's reality stops being useful the second the ground moves.